Simulated Weather Analyzer
Simulated Weather Analyzer
Using an Arduino and a little bit of C, I developed a simulated signal sensing device and analyzer for my System Programming class in the Spring of 2020. The device (Arduino) is capable of running some basic analytics on the (simulated) information and presenting them upon the user’s request.
At a high level, here’s what’s going on:
The Arduino simulates and sends sensor readings of the temperature, humidity and pressure in the environment to the running user-level program. Both the Arduino and the user-level program communicate throughout runtime using the Arduino’s serial connection. The data gathered by the Arduino is stored in the user-level program, where it is analyzed. From there, users can easily query the analyzed data and readings in a variety of ways.
For a bit more simplicity, I divided the system into three parts:
• Part I: Pre-processing (i.e. data collection, communication)
• Part II: Data processing and storage
• Part III: Data analysis

Part I
I first established a form of communication between the Arduino and the user-level programming. This allowed me to successfully send messages from the Arduino to the user-level program in loop. Once this was all figured out, I developed a few simple commands (i.e. pause, blink, resume, exit) that could be run at user-level whenever we needed the Arduino to do something specific.
With this, we’ve successfully developed a basic user-level program that interacts and communicates with an Arduino!
Part II
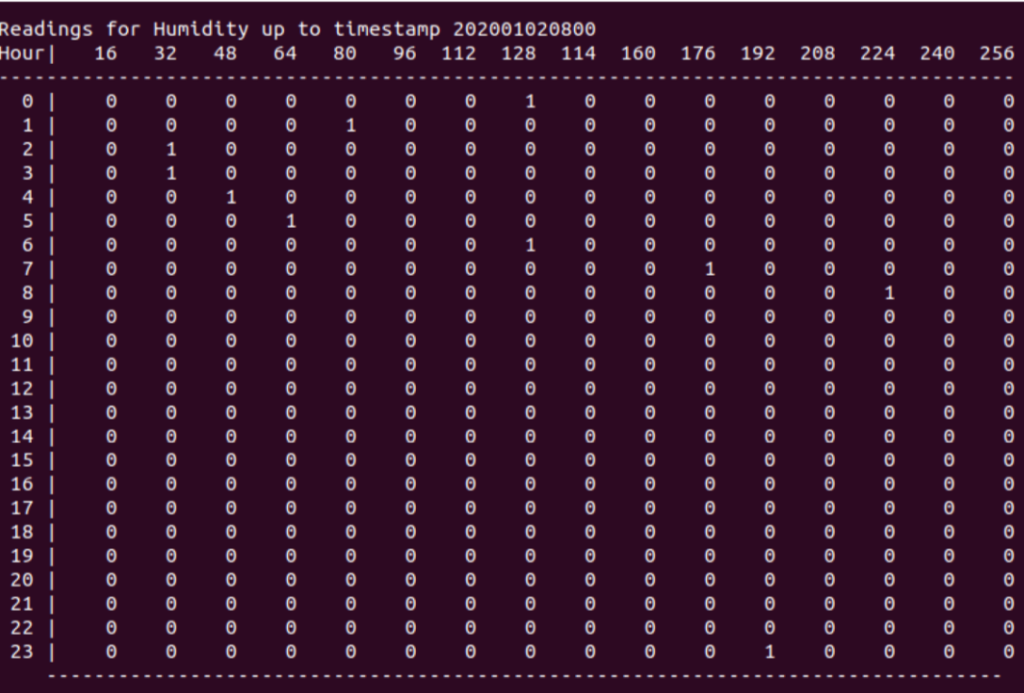
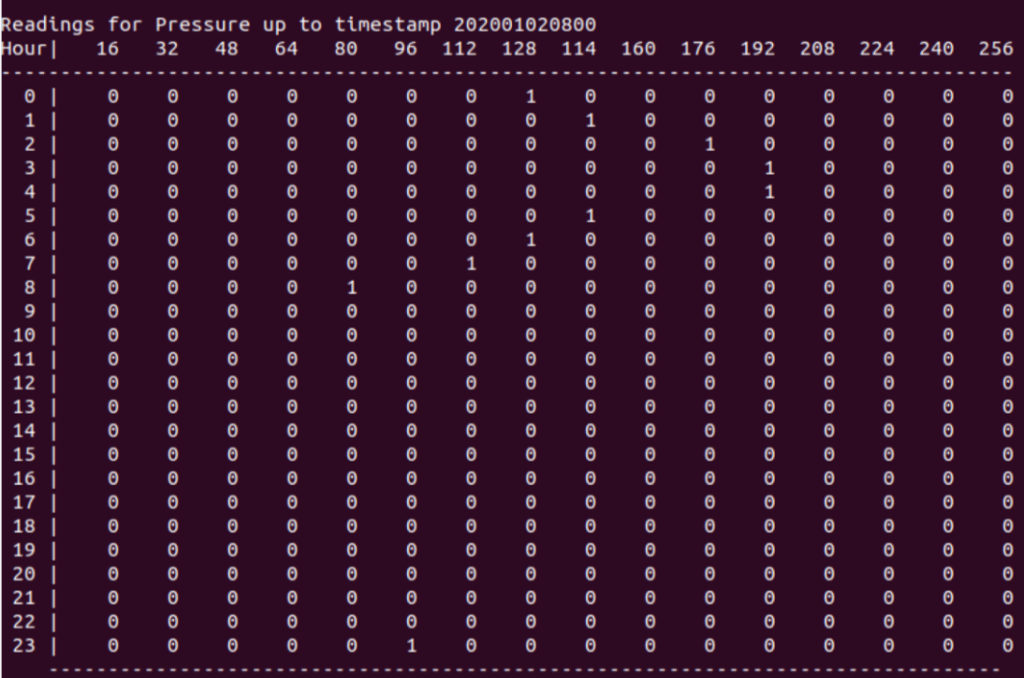
I modified the Arduino’s functionality to where it could now send the specific simulated weather sensor readings to the user-level program. I expanded on the user-level program’s functionality by making it responsible for organizing and compiling this data such that it is easy to read and understandable. That being said, the user-level program could now create histograms for each of the simulated measurements taken and also create a .bin file with all of the sensor readings sent by the Arduino.
Below is a set of some of the histograms generated as a result. There are three measured values: temperature, pressure and humidity.

Part III
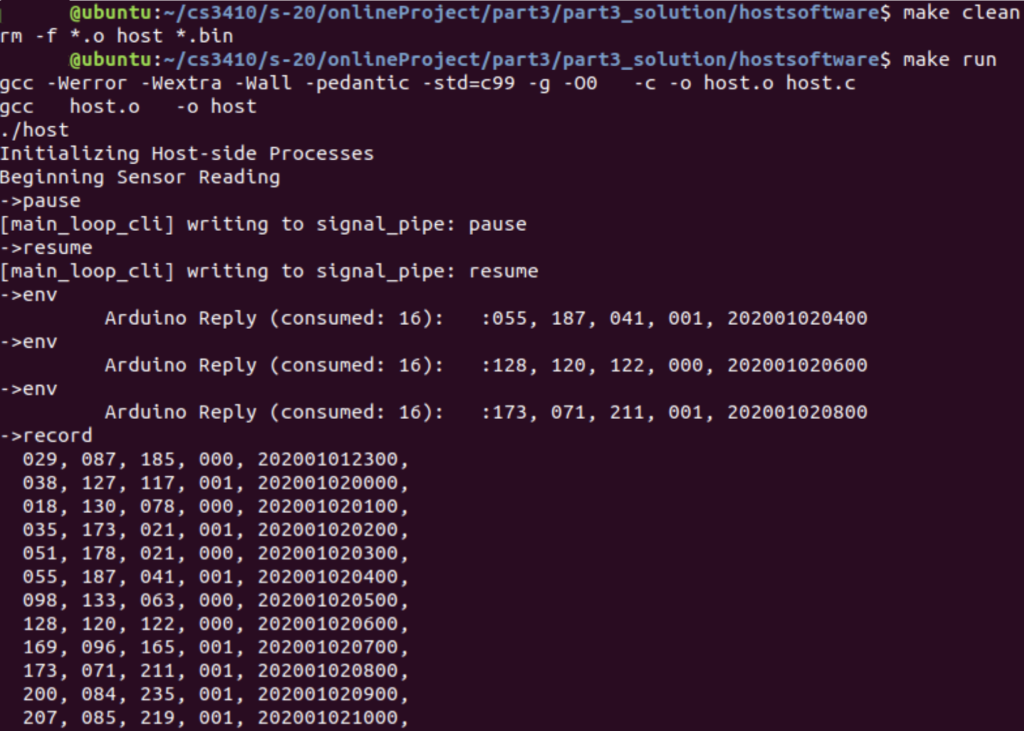
In the final part, I brought together both the user-level program and the Arduino’s functionality by allowing users to run queries.
The user-level program is responsible for two things: processing the user’s query and communicating with the Arduino to deliver the correct information. The Arduino now runs at the command of the user-level program–only sending the requested information.
There are a variety of different queries that the user can run in order to receive some type of response/data:
• env: prints the most recent data point collected
• record: prints the entire dataset
• hist [t, p, h]: prints a histogram of the request data variable (temperature, pressure, humidity)
• pause, resume, exit